Modern factories generate vast amounts of data, but many still struggle to turn it into actionable insights. In the manufacturing industry, data analytics is used to track the manufacturing process, minimise waste and boost efficiency. Manufacturers can leverage manufacturing data analytics and real-time dashboards with the help of data analytics consulting Chicago firms to look for delays, monitor KPIs and make informed decisions about their operations.
The costs benefits associated with investing in advanced maintenance techniques is not well understood. Using data collected from manufacturers, we estimate the national losses due to inadequate maintenance and make comparisons between those that rely on reactive maintenance, preventive maintenance, and predictive maintenance. The total annual costs/losses associated with maintenance is estimated to be on average $222.0 billion, as estimated using Monte Carlo analysis. Respondents were categorized into three groups and compared. The first group is the top 50 % of respondents that rely on reactive maintenance, measured in expenditures.
What Is Manufacturing Data Analytics?
Manufacturing data analytics can be used to collect and analyze manufacturing data to increase production, minimize waste, and monitor machine performance. Factories or warehouse management systems collect data from the sensors, manufacturing machinery, ERP and MES software, and supply chain management platforms.
Instead of relying on manual spreadsheet reporting, modern manufacturing data analytics solutions can give real-time data on potential production bottlenecks and inefficiencies. Manufacturing companies can leverage this data with the assistance of expert data analytics consulting to make more informed operational choices.
Why Is Manufacturing Data Analytics Important for Modern Businesses?
The application of data analytics to manufacturing industry operations provides measurable advantages to companies over those of their slower rivals. Let’s see why modern plants are turning to creating data analytics services:
♦ Improve Production Efficiency
Data reveals bottlenecks and slowdowns throughout assembly lines. Supervisors can compare machine speeds to target speeds to rebalance workloads, reduce changeover times and smooth out the daily flow.
♦ Reduce Manufacturing Costs
Each down time and each scrap is a loss of profit. Manufacturing data analytics in detail identifies where raw material, overtime and energy surges are happening, and enables leaders to reduce unnecessary costs by 10% to 20%.
♦ Improve Product Quality
By monitoring inspection logs in conjunction with machine settings, the actual conditions which lead to defects can be determined. Laboratories can quickly change the temperature, pressure or speed at the factory to make sure each batch is the same.
♦ Minimise Equipment Downtime
Changes in plans cause all projects to stall. Leading data analytics companies in Chicago help manufacturers deploy predictive analytics, using historical sensor patterns to warn maintenance teams days before a motor or bearing actually fails.
♦ Improve Supply Chain Management
When the schedule on the shop floor is matched with the vendor records, there are advantages in tracking inventory, forecasting demand, and monitoring vendors. Plants prevent exorbitant stock-outs and maintain a lean warehouse.
How Do Manufacturing Data Analytics Dashboards Work?
A manufacturing dashboard is a wallboard, desktop, and/or tablet-based visualization of real-time plant information. Teams avoid sifting through rows of raw numbers and instead view clear charts, gauges and color coded status lights.
These dashboards automatically pull PLC, warehouse tools, ERP databases and quality scanners. Numerous factories in the Midwest are working with data analytics services in Chicago to integrate old equipment with new viewable displays. Manufacturing data analytics services convert the often complex factory logs into easy-to-view bar charts and trend lines, allowing performance to be immediately in sight.
➜ Essential Features of a Manufacturing KPI Dashboard
• Real-time production monitoring: actual production compared to the target production in the shift.
• Machine performance tracking: Instant run/stop status, speed rate per machine and OEE scores per line.
• Quality and defect reporting: Shift-by-shift scrap rates & top defect categories.
• Production efficiency analysis: Cycle time comparison of shifts and operators.
• Inventory and supply chain visibility: Real-time inventory information for raw material and finished goods.
• Customisable KPI reports: Personalised reports for floor operators, plant managers and executives.
• Automated alerts and notifications: Text or screen alerts as soon as a machine stops or defects increase.
Also Read : 10 Best Manufacturing Analytics Companies in the USA to Consider in 2027
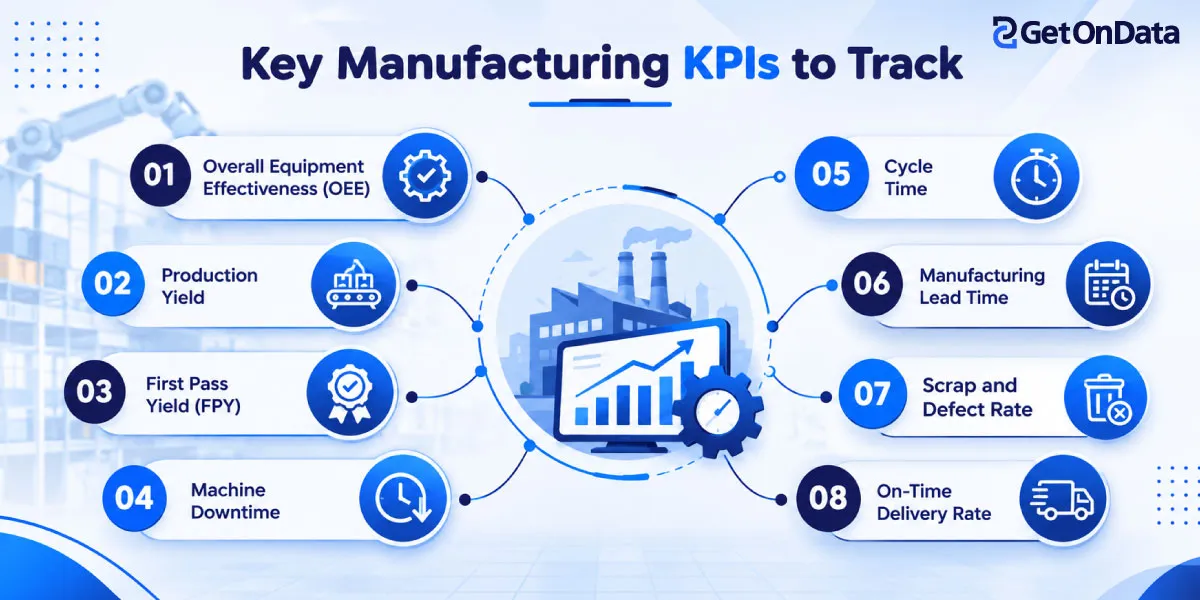
What Are the Key Manufacturing KPIs to Track?
For manufacturing teams to derive maximum value from manufacturing data solutions, they need to concentrate on clear and measurable numbers instead of everything.
☛ Overall Equipment Effectiveness (OEE)
OEE is considered to be the “Gold Standard” metric for factory productivity. It is defined by the combination of Availability, Performance and Quality, and is the actual percentage of productive manufacturing time. World class plants will strive to achieve an 85% or greater.
☛ Production Yield
Production yield is the percentage of finished goods with respect to the input of raw materials and indicates material efficiency.
☛ First Pass Yield (FPY)
FPY is a measurement of the percentage of units produced first time correctly without scrap or rework. Labor and material waste are directly reduced by a high FPY.
☛ Machine Downtime
This measures planned maintenance stops and equipment breakdowns. The downtime minutes per root cause indicates when assets must be upgraded.
☛ Cycle Time
Cycle time is the specific time taken to process one unit or one production step – either in seconds or minutes. A change in cycle time can indicate that the machine is in slow drift.
☛ Manufacturing Lead Time
Lead time is the time it takes from when a customer orders to when the product is delivered. The shorter the lead time, the quicker the cash flow, and the more you will please your buyers.
☛ Scrap and Defect Rate
This KPI is the proportion of defective products removed from the manufacturing process. Recognizing defect spikes early will avoid the production of unusable products by entire shifts.
☛ On-Time Delivery Rate
On-time delivery reflects the proportion of orders delivered by the deadline as a clear indicator of the factory’s reliability and customer’s confidence.
Real-World Use Cases of Manufacturing Data Analytics
By investing in data analytics services and solutions, companies can reap tangible benefits throughout the entire plant:
➭ Predictive Maintenance
Critical presses and conveyors are continuously monitored for heat, noise, and vibration to catch potential issues early. Using data analytics services in Chicago, manufacturers can identify unusual patterns, spot signs of equipment wear, and plan repairs during scheduled downtime. This helps keep operations running smoothly, avoid unexpected breakdowns, and reduce unplanned downtime by up to 30%.
➭ Production Process Optimisation
Manufacturing data analytics can identify the build up of parts by mapping cycle time at each workstation. Staffing levels or machine feeds can be altered when necessary to maintain smooth lines.
➭ Quality Control and Defect Detection
The high-speed cameras and machine learning system scan the belt for products, identifying minute misalignment or cracks which would be undetectable by manual process.
➭ Inventory and Supply Chain Optimisation
Predictive models take into account raw material orders against live production schedules, avoiding the need to over-stock warehouses and ensuring parts are on site on time.
➭ Energy Consumption Monitoring
Smart meters are used to monitor the consumption of electricity and gas per machine. Factories pinpoint equipment that consumes energy during periods of inactivity, and re-route heavy loads to lower rates during off-peak periods.
➭ Demand Forecasting and Production Planning
Historical order data, when combined with market trends, can assist commercial teams with planning ahead. Leaders coordinate factory capacity with customer demand, understand the product lines with high margins using the best tools for data analytics manufacturing sales.
What Technologies Are Used in Manufacturing Data Analytics?
Data analytics solutions for modern manufacturing are built on five fundamental technologies:
➢ Internet of Things (IoT)
Industrial IoT sensors mount on new and existing equipment and transmit all the data without the need for manual input, such as temperature, pressure, and count data.
➢ Artificial Intelligence and Machine Learning
AI and ML algorithms sift through millions of historical data records to identify subtle failure patterns, automate visual quality checks and suggest quicker production schedules.
➢ Cloud Computing
Cloud platforms offer secure storage that is scalable and allows multi-plant business to access live shop floor dashboards anywhere in the world.
➢ Big Data Analytics
High speed sensor streams are processed together with years of ERP and orders in seconds, by big data engines.
➢ Business Intelligence Tools
Today’s BI solutions, such as the top BI tools for data analytics, manufacturing sales and plant operations such as Power BI and Tableau, convert cleansed data into interactive charts and executive scorecards.
How to Implement Manufacturing Data Analytics in Your Business
Rolling out data analytics in manufacturing industry facilities works best when done step by step:
➥ Identify Business Goals
Begin with a couple of good goals, for example, reduce your scraps by 15% or improve OEE for your busiest packaging line.
➥ Collect Data from Manufacturing Systems
Show where your numbers reside in PLCs, ERP software, maintenance logs and quality spreadsheets. Teaming up with data analytics consulting Chicago specialists can accelerate machine integration.
➥ Clean and Organise Manufacturing Data
Use consistent reason codes, part numbers and downtimes for all departments, so that everyone is on a single, dependable source of truth.
➥ Select the Right Manufacturing Analytics Software
Select platforms that integrate seamlessly with current equipment, grow as your plant grows and boast user-friendliness, including the best analytics manufacturing sales and shop-floor reporting capabilities. Often trusted data analytics companies in Chicago evaluate and test software before it is rolled out before the rest of the world.
➥ Build Manufacturing KPI Dashboards
Create simple, high-contrast screens specific to each role, beginning with a 30 day pilot on one production line and roll-out plant-wide.
Also Read : Data Analytics Trends 2026 That Will Shape the Future of Business Intelligence
Key Benefits of Manufacturing Analytics Solutions
Data analytics’ value to the manufacturing floor is directly to the bottom line:
• Better production efficiency: shortened production cycles and reduced line delays.
• Improved equipment performance: Larger OEE and longer machine life.
• Lower operating costs: Minimize scrap, energy and overtime costs.
• Better product quality: Higher initial production yields and reduced returns from customers.
• Data-Driven Business Decisions: Planning with confidence, not blindly.
Understanding the benefits of data analytics in manufacturing makes it clear why forward-thinking plants treat data as their most valuable asset.
Ready to Improve Manufacturing Performance with Data Analytics?
One of the smarter investments a factory can make is to move from firefighting to proactive, data-driven production. From preventing unexpected production hiccups to improving first pass yield to assessing the most effective tools for data analytics manufacturing sales, the right data analytics services and solutions convert noise on the shop floor into profit growth.
In addition to trusted data analytics services in Chicago and top data analytics companies in Chicago, experienced data analytics consulting for manufacturing teams can select appropriate KPIs, link your machines, and start providing clear real-time dashboards. Adopt one high impact production line, monitor your key metrics every day and enjoy the perks of data analytics in manufacturing throughout your operation.

 Data Engineering